Parts 1 to 4 built protection for one application with kubectl and YAML. This last part is about running NDK after that: giving people a UI without giving them kubectl, scripting with ndkcli, knowing what your monitoring can and cannot see, and the two rules that apply when an application does not fit in one namespace.
As before, everything below was run on our lab (NKP 2.18, NDK 2.3.0) on 2026-09-19.
All manifests in this part are in github.com/Fen0l/ndk-examples, the same files we applied on the lab.
The NDK UI: what the two roles really are
NDK 2.3 ships its UI in the main chart. Enabling it is two values (ui.enable=true, plus the image location in an air-gapped registry) and a users file. Here is what it deploys and how the roles work.
kubectl -n ntnx-system get ingress,certificate,svc -l app.kubernetes.io/name=ndk-ui
NAME                               CLASS               HOSTS            ADDRESS      PORTS     AGE
ingress.networking.k8s.io/ndk-ui   kommander-traefik   ndk.itcs.local   10.12.52.6   80, 443   25d

NAME                                             READY   SECRET       AGE
certificate.cert-manager.io/ndk-ui-server-cert   True    ndk-ui-tls   25d

NAME                     TYPE        CLUSTER-IP      EXTERNAL-IP   PORT(S)   AGE
service/ndk-ui-service   ClusterIP   10.97.129.135   <none>        80/TCP    25d
On NKP the Ingress goes through the platform's Traefik, and with ISSUER TLS mode the certificate comes from kommander-ca, the same CA that signs the NKP dashboard. Users who already trust the NKP dashboard get no browser warning.
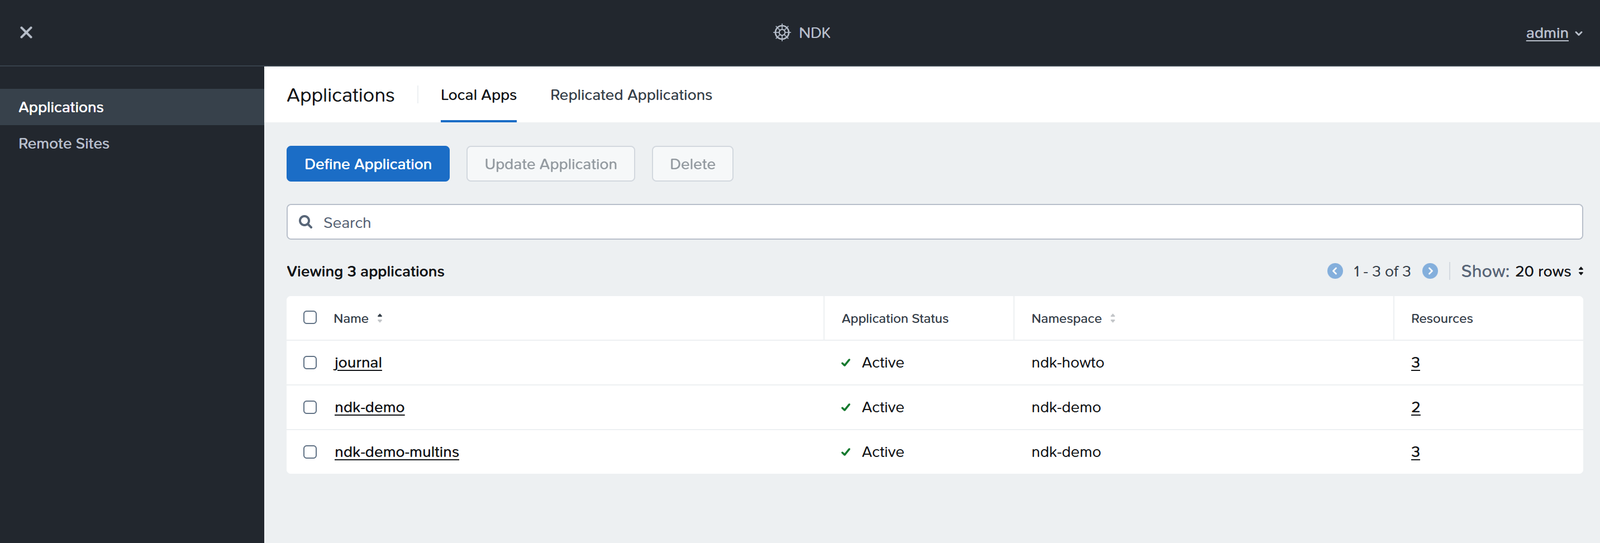
Two menus, Applications and Remote Sites, and that is the whole UI. Logged in as admin, the Applications list shows the three Applications from this series with their namespace and the number of resources each one collected:
The users file gives each login a role, ADMIN or VIEWER. Those are not just UI labels. The chart creates two ClusterRoles, and the UI's service account impersonates one of them for every request:
for r in ndk-ui-viewer ndk-ui-admin; do
  kubectl get clusterrole $r -o json \
    | jq -c '.rules[] | select(.apiGroups | index("dataservices.nutanix.com")) | select(.resources | index("applications")) | {verbs}'
done
{"verbs":["get","list","watch"]}
{"verbs":["get","list","watch","create","update","patch","delete"]}
Both roles cover all 19 NDK resource kinds, plus read access to core objects (Deployments, PVCs, StorageClasses) so the UI can show what an Application selects. VIEWER is a real read-only role enforced by the Kubernetes API server, not a hidden button. That matters for the on-call engineer who needs to see whether last night's snapshot ran without being able to delete anything.
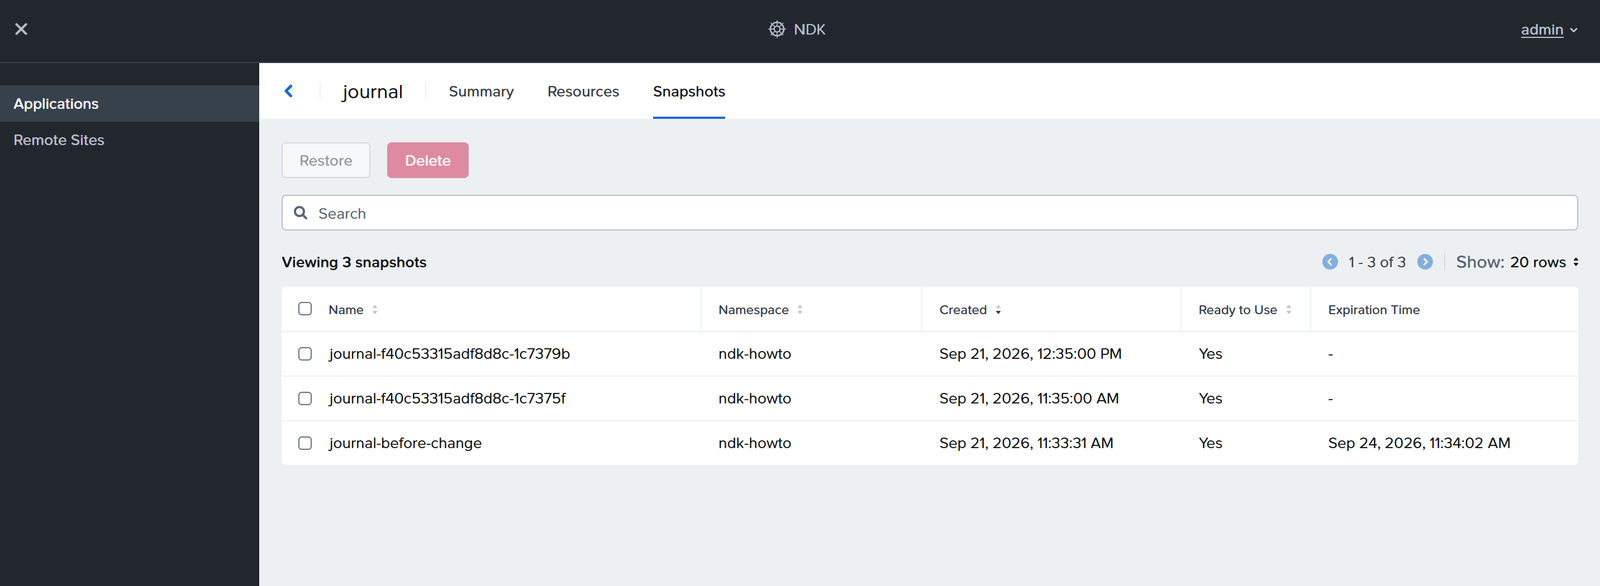
The same page through both roles makes the point. The snapshots of journal as admin, with Restore and Delete:
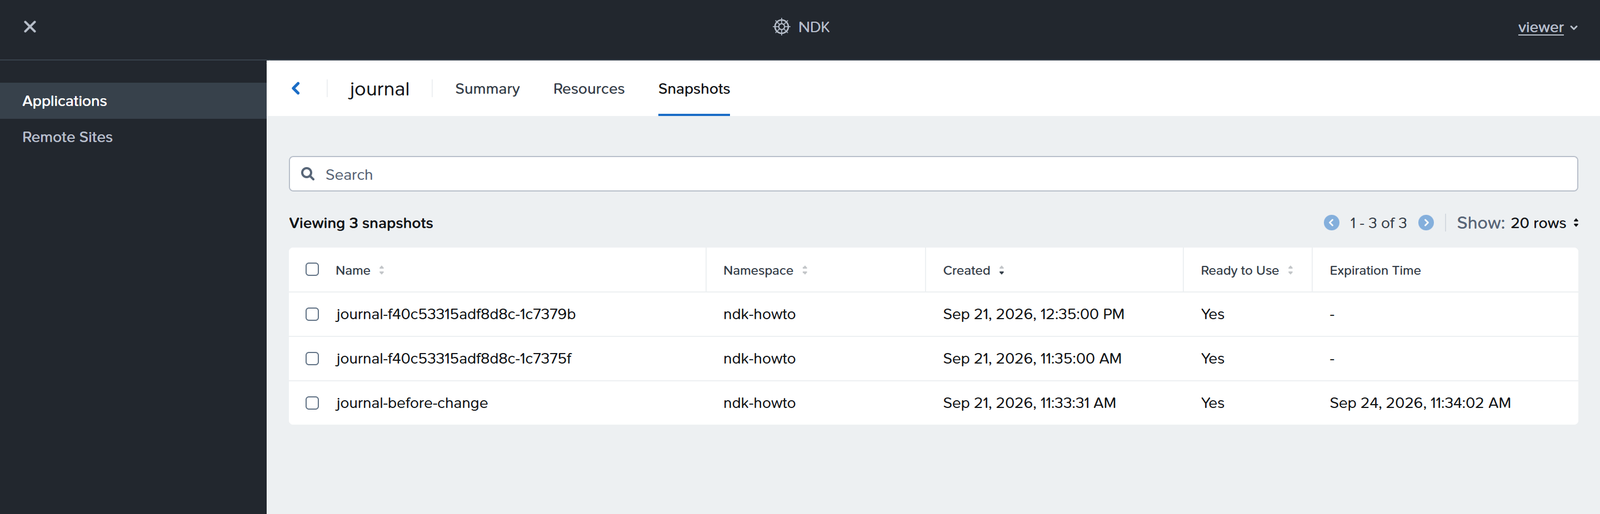
And as viewer: same three snapshots, same columns, and no buttons at all. The UI does not grey them out, it does not render them, because the impersonated ClusterRole has no create or delete verb.
The UI talks to its own backend on /graphql. Unauthenticated, it answers with a clean error and nothing else:
curl -sk -X POST https://ndk.itcs.local/graphql -H 'Content-Type: application/json' -d '{"query":"{ me { username role } }"}'
{"errors":[{"message":"Authentication required. Please log in.","extensions":{"code":"APP_NOT_AUTHENTICATED"}}],"data":{"me":null}}
Schema introspection is disabled in production builds, so the API surface is not enumerable from outside. Sessions are a __Host- cookie with a sliding expiry and an absolute cap (NDKUI_SESSION_ABSOLUTE_MAX, 8h by default). There is no SSO integration in 2.3; the users file is the only identity source, so keep it short and rotate it like any other credential.
One operational note: every action in the UI creates the same CRs you wrote by hand in Parts 1 to 4. When someone clicks "snapshot" in the UI, kubectl get applicationsnapshot shows it seconds later. There is no separate UI state, which makes GitOps and the UI coexist without surprises.
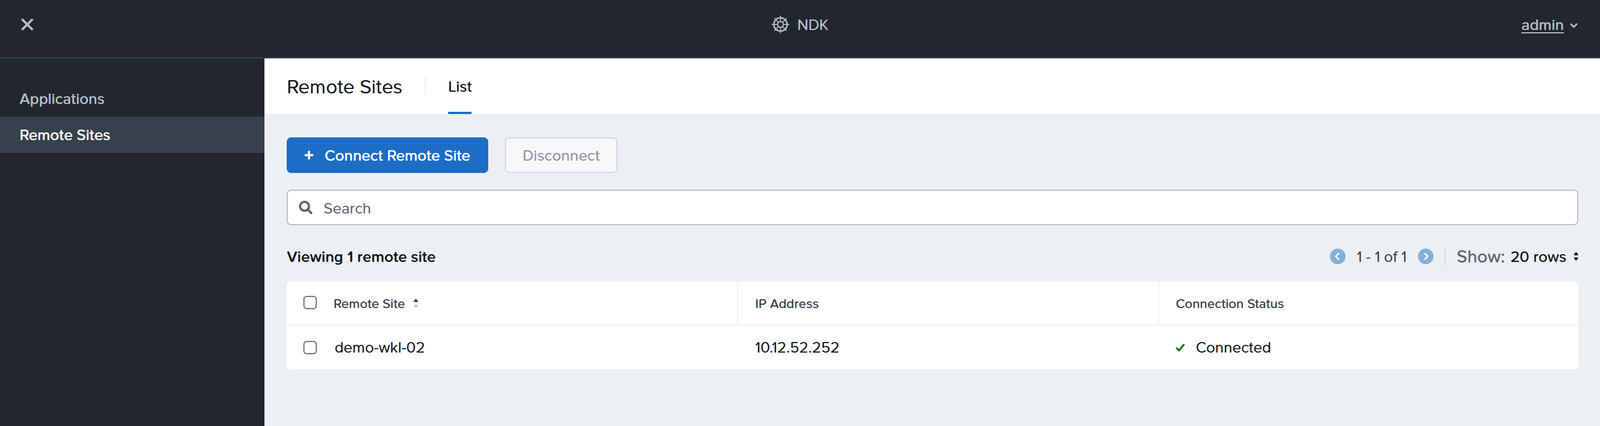
We tested that the other way round too. The Remote Sites page shows the Remote from Part 4 as a connected site:
And "Protect Application" on ndk-demo-multins let us pick a Synchronous protection type to that site and save it:
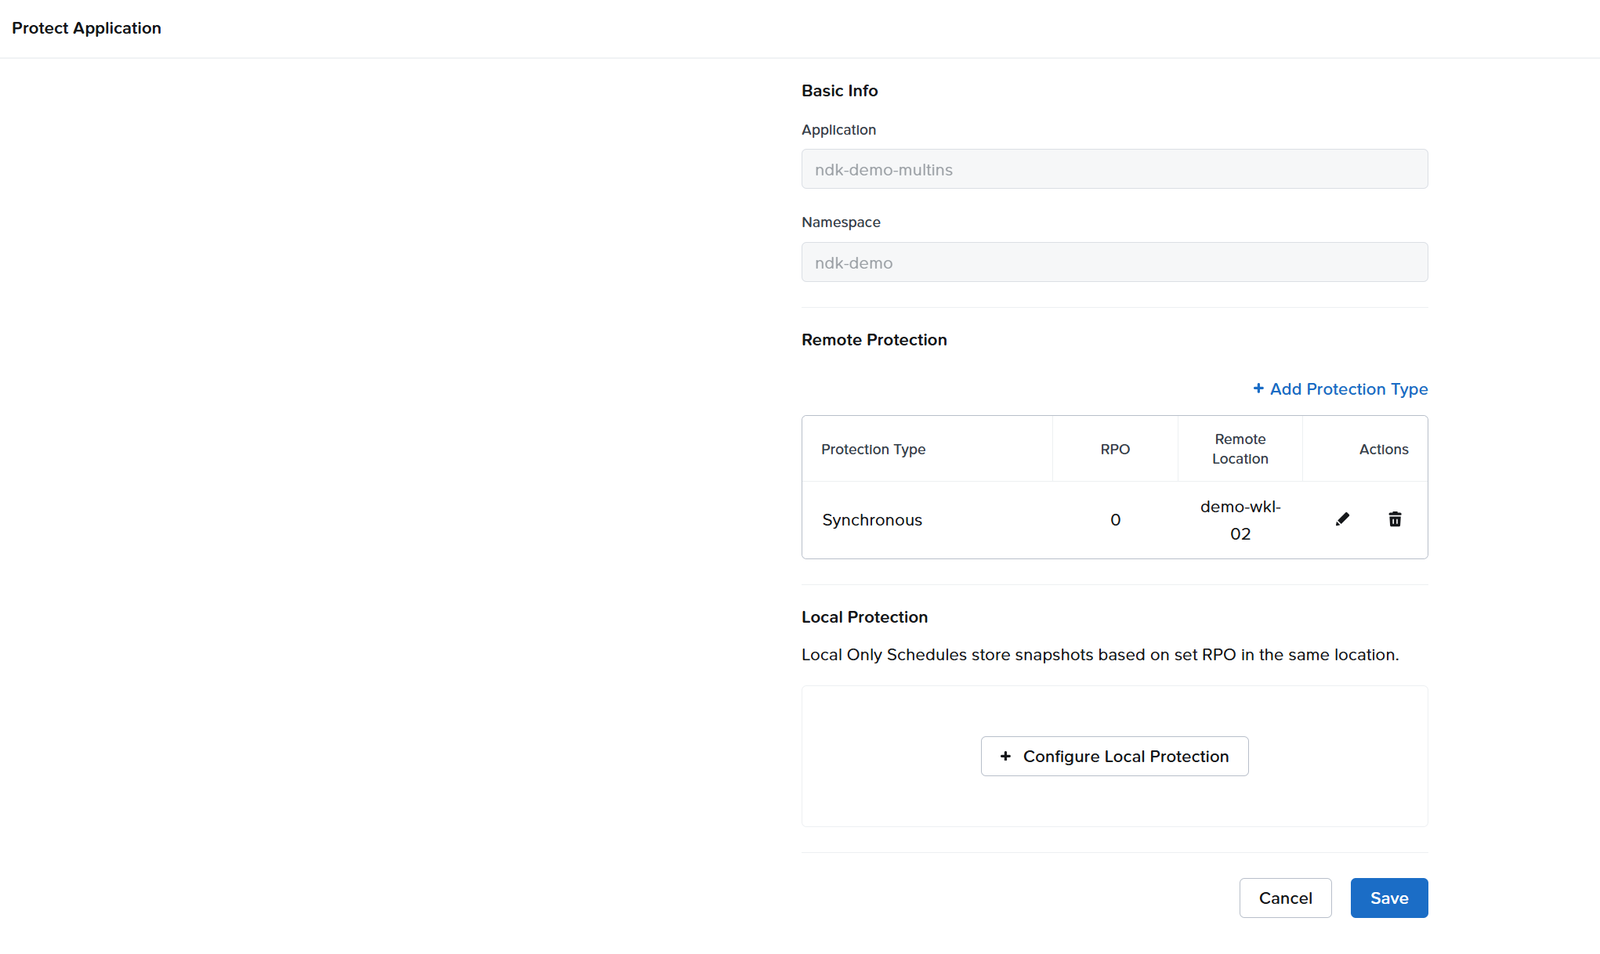
Seconds later the CRs existed, with generated names:
kubectl -n ndk-demo get protectionplan,appprotectionplan
NAME                                                                    SCHEDULE-NAME   RETENTION-COUNT   AVAILABLE   DEGRADED   PROTECTION-TYPE
protectionplan.dataservices.nutanix.com/demo-local-plan                 demo-daily      3                 True        False      async
protectionplan.dataservices.nutanix.com/pplan-ndk-demo-multins-sync-78xm1f                                False       False      sync

NAME                                                                        APPLICATIONNAME    PROTECTIONPLANS-APPLIED                  AVAILABLE   DEGRADED
appprotectionplan.dataservices.nutanix.com/appplan-ndk-demo-multins-i0n38k   ndk-demo-multins   ["pplan-ndk-demo-multins-sync-78xm1f"]   False       False
AVAILABLE: False, because our two clusters share one Prism Element and sync replication needs two. The UI let us save it, the controller refused it, and the reason is exact:
Available=False SyncReplicationPrechecksFailed: primary and secondary sites for PPlanTypeSync must reside on different Storage Servers.
Current StorageServerUuids - Primary: 000623f4-7174-ae2a-0000-00000001c1da, Secondary: 000623f4-7174-ae2a-0000-00000001c1da
Same lesson as Part 3: the UI and the CRs are one system, and the CR status is where the truth is. Check kubectl get protectionplan after any click that creates protection. It also means the Kubernetes audit log attributes UI actions to the UI's service account and the impersonated role, not to the person logged in: login usernames never reach the API server.
ndkcli: kubectl with NDK verbs
ndkcli is a small Go binary shipped with the bundle. It knows the NDK objects and delegates everything else to kubectl:
ndkcli version
CLI Version: v2.3.0
NDK Release Name: ndk
NDK Chart Name: ndk
Available Commands:
  completion  Generate the autocompletion script for the specified shell
  create      Create NDK resources
  help        Help about any command
  perform     Perform failover or restore operations on an application
  protect     protect commands for applying protection plan to an application
  replicate   Replication command for managing snapshot replication
  version     Show the version of the CLI and NDK installed on the cluster
ndkcli create knows application, snapshot, protectionplan, replicationtarget, storagecluster and fsreplicationrelation.
The useful property is --dry-run=client -o yaml. It turns a one-liner into the manifest you would commit:
ndkcli -n ndk-howto create snapshot journal-cli-1 --application=journal --expires-after=2h --dry-run=client -o yaml
apiVersion: dataservices.nutanix.com/v1alpha1
kind: ApplicationSnapshot
metadata:
  name: journal-cli-1
  namespace: ndk-howto
spec:
  expiresAfter: 2h0m0s
  source:
    applicationRef:
      name: journal
status: {}
Without --dry-run it creates the object, and ndkcli get applicationsnapshot is just kubectl get. We use it for the pre-change snapshot in scripts (the --expires-after default is 24h, which fits that use) and for generating first drafts of manifests. For anything that lives longer than a change window, the YAML goes in Git and ndkcli is not involved.
What Prometheus sees
The chart can create a ServiceMonitor for the controller. On NKP the platform Prometheus only picks up monitors carrying a specific label, so the values look like this:
prometheus:
  enable: true
serviceMonitor:
  customLabels:
    prometheus.kommander.d2iq.io/select: "true"
Note that serviceMonitor.customLabels sits at the root of the values, not under prometheus. The 2.3 chart's template reads it from the root while values.yaml documents it under prometheus.serviceMonitor. With prometheus.enable=true alone the chart fails to render; put the labels at the root and it works. We reported this to Nutanix in August.
With that in place the target is up and scraped over HTTPS with the service account token:
ndk-controller-manager-metrics-service up https://192.168.8.191:8443/metrics
Now the part you need to know before you build a dashboard: NDK exposes no product metrics. The endpoint serves the standard controller-runtime and Go families, nothing named ndk_*, nothing about snapshots, their age, their size, or replication lag. What you get is reconcile counters per controller:
# in the platform Prometheus
sum by (controller) (increase(controller_runtime_reconcile_total{job="ndk-controller-manager-metrics-service",result="error"}[1h])) > 0
applicationsnapshot             5.042016806722689
applicationsnapshotcontent      3.0252100840336134
applicationsnapshotreplication  1.00276918767507
appprotectionplan               1.00276918767507
storagecluster                  12.100840336134453
(increase() extrapolates over the window, hence the decimals.)
That is our lab in the hour after Prism Central briefly rejected the service account (the 401 story from Part 3): the storagecluster controller failed reconciles while it could not reach PC, and the snapshot controllers logged the failed snapshot attempts. An alert on this query catches "NDK is unhappy". It does not tell you that the nightly snapshot of one application is 30 hours old.
For that, the honest answer today is: query the API. The check from Part 3 (newest readyToUse: true snapshot per Application, compared with the schedule) is a few lines of kubectl and jq, or a kube-state-metrics custom resource state configuration if you want it in Prometheus. NKP already ships kube-state-metrics with a custom resource configuration (it exposes control plane certificate expiry that way), so the mechanism is there. We have not wired NDK snapshots into it yet; when we do, it will be its own article.
One small thing we noticed in the target list: the platform's pod discovery also tries the UI pod on port 4010 and marks it down, because that port serves HTML, not metrics. Harmless, but it will show up as a red target.
Applications across namespaces
By default an Application selects resources in its own namespace only. NDK 2.3 can span namespaces if you turn it on, and the flag goes through the chart:
config:
  controllerManagerConfig:
    flags:
      - --zap-devel=false
      - --enable-multins=true
Careful with that list: it replaces the chart's extra flags rather than appending to them, so keep --zap-devel=false in there when you add yours. The hard-coded flags (the exclude list and the skip-on-restore list we met in Parts 1 and 2) are not affected.
With the flag on, the selector gains a namespaceSelectors block. Our ndk-demo-multins application on the lab spans two namespaces:
spec:
  applicationSelector:
    namespaceSelectors:
      includeNamespaces: [ndk-demo, ndk-demo-b]
    resourceLabelSelectors:
      - labelSelector:
          matchLabels:
            app.kubernetes.io/part-of: multins-test
        excludeResources:
          - group: cilium.io
            kind: CiliumEndpoint
"resourcesByNamespace": {
  "ndk-demo":   { "v1/ConfigMap": [ { "name": "multins-frontend-config" } ] },
  "ndk-demo-b": { "apps/v1/Deployment": [ { "name": "multins-b-writer" } ], "v1/PersistentVolumeClaim": [ { "name": "multins-b-data" } ] }
}
A ConfigMap in one namespace, a Deployment and its PVC in another, one snapshot. That is what you want for an application whose frontend and database teams own different namespaces.
One resource, one Application
The second rule is not tied to multi-namespace, but that is where you hit it first. NDK enforces exclusive ownership: a Kubernetes object can belong to one Application at a time. We tested it by creating a second Application with the same label selector as journal:
kubectl -n ndk-howto get application
NAME              AGE   ACTIVE   LAST-STATUS-UPDATE
journal           35m   True     2m45s
journal-overlap   5s    True     5s
Both report ACTIVE: True and ResourcesCollected. NDK does not complain at this point. It complains when you try to use the second one:
ndkcli -n ndk-howto create snapshot overlap-snap --application=journal-overlap --expires-after=1h
AppConfigAcquired=False FailedAcquiringAppConfig: failed to snapshot application since application contains resources which are currently not supported for snapshot
The message is not precise about the cause. The same selector snapshots fine through the journal Application, so the only difference is that those resources are already claimed. When we ran the same experiment in August with two multi-namespace Applications, the message named the conflict (Discovered by other app: <namespace>/<app>), so the wording depends on the path. Either way: an Application that collects resources correctly but cannot snapshot is the signature of an overlap.
The practical consequence is a naming discipline. One app.kubernetes.io/part-of value per Application, never reused across namespaces you might later combine, and no "catch-all" Application per namespace next to specific ones.
Cleaning up the lab
For completeness, this is the teardown of everything the series created, in the order NDK accepts it:
kubectl -n ndk-howto delete appprotectionplan journal-protection
kubectl -n ndk-howto delete protectionplan journal-hourly-to-demo-wkl-02
kubectl -n ndk-howto delete jobscheduler journal-hourly
kubectl -n ndk-howto delete applicationsnapshotreplication --all
kubectl -n ndk-howto delete applicationsnapshot --all
kubectl -n ndk-howto delete replicationtarget demo-wkl-02
kubectl -n ndk-howto delete application journal
kubectl delete namespace ndk-howto
And the same on the target cluster, minus the plan objects. The Remote stays: it belongs to the cluster pair, not to one application.
Summary
Day-2 NDK on NKP comes down to four things. The UI's ADMIN and VIEWER are real Kubernetes RBAC roles, so you can hand out read-only access safely. ndkcli is handy for one-off snapshots and for drafting manifests, not a replacement for YAML in Git. Prometheus gets controller health from NDK but no snapshot-level metrics, so freshness checks still go through the API. And when applications span namespaces, turn on --enable-multins, keep the chart's default flags, and never let two Applications claim the same object.
That closes the series. The five parts are the runbook we now use on client clusters: concepts and the Application, snapshot and restore, scheduled protection, replication, and this one. NearSync and application-consistent snapshots need a lab topology we do not have yet; when we do, they get their own parts.